Ignore the Market's Mood
By
Murray Leith CFA, Executive Vice President & Director, Investment Research
Tuesday, February 13, 2018

Have you ever used the expression “woke up on the wrong side of the bed” to describe yourself or someone else? It’s typically used to label a grumpy or irritable person, especially when the reason for their unhappiness is unknown. Sometimes the market’s mood turns foul without good reason. We think we are at one of those junctures, and believe that it would be a mistake to overreact to recent market gyrations.
As we explained in last week’s blog post, “Thoughts on the Market Correction,” the recent setback was triggered by good economic news. The worry, which we believe is overblown, is that the U.S. Federal Reserve will take the proverbial punch bowl away from the stock market party by raising interest rates in the face of stronger economic growth and higher inflation. The lack of corroborating evidence, our understanding of human nature and hopefully our experience, are among the factors that calm our nerves, while helping us to ignore the market’s mood.
Investors who are selling stocks in the downturn are behaving as though a recession is around the corner; yet bond, commodity and currency markets are not reacting the way one would expect if an economic downturn were likely. Despite a 10% peak-to-trough correction in U.S. stocks, there hasn’t been the typical “flight to safety” into U.S. Dollars, Yen, Euros or Pounds. Nor has there been much movement in developed world bond yields. Commodity prices have also been relatively stable, although oil prices have been a little weak lately.
Fear and greed are powerful emotions, and it is human nature to extrapolate trends. We are hard-wired to believe the outlook is good when stocks are going up and bad when they are going down. Consequently, our thinking typically fuels self-fulfilling behaviour and reaffirms market action as we buy in rising markets and sell in falling markets. The media adds gas to the emotional fire by sensationalizing market movements to increase its audience.
We don’t doubt that some investors sold in a panic upon learning last Monday that “the Dow Jones Industrial Average had its biggest daily point drop in history.” The important facts, however, often differ from the headlines. In this case, it’s the percentage that matters, not the point count. The Dow Jones Industrial Average dropped 1,175 points (4.6%) on Monday, February 5. The Black Monday crash in 1987 was a much lesser 508 points, but in percentage terms the decline was almost five times as bad at 22.6%. That was the biggest one-day drop in history!
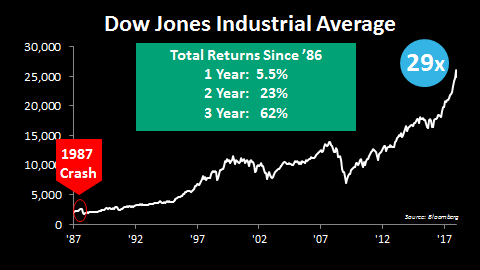
From peak-to-trough, the Dow experienced a 36% decline in 1987. From the recent peak to the market close on Thursday last week, the Dow had fallen less than one-third that amount (the market ended “up” the next day). Looking back at the Dow’s long-term chart, the 1987 crash is merely a blip in a long upward march.

Despite the correction, the Dow still returned 5.5% in 1987 (including dividends). Over two years, the total return was 23%, and in three years it was 62%. Someone lucky enough to own the Dow since 1986 would have a 29-fold gain*.
We make the comparison to 1987 because the economic backdrop and investor attitudes were similar to conditions today. The economy was strong, inflation was picking up, and the Fed was raising interest rates. The market had had a huge run up back then, similar in magnitude to the advance made since President Trump was elected, and people had become used to a one-way market. When a turn came, too many people tried to rush for the exits at the same time, which caused investors to panic.
The market ultimately recovered in 1987 because the underlying economy was strong, and we think the same will be true this time.
* Assuming dividends were reinvested along the way.